WFCAM Linearity
We have undertaken a study of the linearity of WFCAM. We have
attempted to measure it using three approaches:
- From dome flat sequences
- From sequences of observations of star fields
- From comparisons with 2MASS data
1. Dome Flat Sequences
Currently we have analysed two sets of dome flat sequences, one
measured in March 2005, and then a newer set measured in May
2006. Both sets of observations and anlysis are described below.
March 2005
We analysed a single dome flat sequence measured on 16-Mar-2005, made
up of 20 images with exposure times ranging from 1 to 20 seconds. The
images comprise a series of CDS exposures (with integration time
ti) with the K filter using ambient dome
illumination. For each image we measured the median counts
di in a windowed section (64x64 pixels) on each
detector (all in channel one).
We make the assumption that the data is linear, then fit a model
di = A + B ti
The residual non-linearity (percentage) is defined as
100 { di - ( A + B ti ) } / di
 |  |
Figure 1: The left hand plot shows median counts
(di) against exposure time
(ti. Overlaid are the linear fits described in the
text. On the Right hand side we plot the percentage deviation from
the fit, i.e the non-linearity. On both plots the chips are colour
coded (#1:Black, #2:Red, #3:Green, #4: Blue).
We see no evidence for non-linearity at the >1% level. The
fluctuations in counts at the bright end appear correlated between the
chips. This is better illustrated in Figure 2 (below), which shows
that the background illumination was almost certainly varying during
the exposure sequence.
 |
Figure 2: Percentage
deviation from
linearity as a function of exposure time for all four detectors
(colours as in Figure 1.
May 2006
Further dome sequences were measured on May 26th 2006. One J-band
sequence is described here. Short (2 sec) exposures were interspersed
between the longer (4-30 sec) exposures to enable the background
illumination to be measured. The background rate was found to drop by
about 50 counts/sec/pixel over the 30 mins it took to run the
sequence.
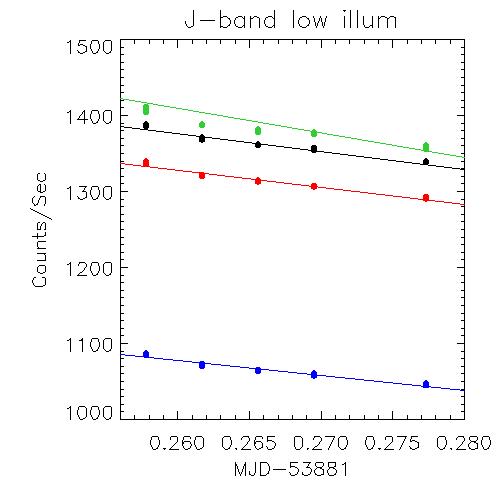 |
Figure 3: J-band
background counts per second measured with 2 sec exposures over the
duration of the dome flat sequence.
To account for the varying background, we made a simple linear fit to
the background rate versus MJD. The counts in each exposure in the
dome sequence were corrected to account for the varying
illumination. The corrected counts versus exposure are plooted
below. We applied the same analysis as above, and the results are
shown below in the right hand panel.
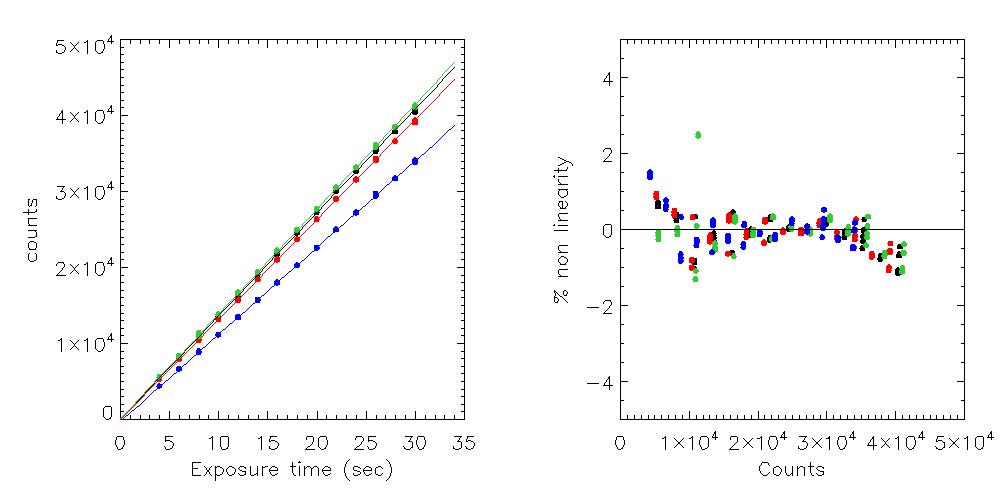 |
Figure 4: The left hand
plot shows median counts (di) against exposure time
(ti. Overlaid are the linear fits described in the text. On
the Right hand side we plot the percentage deviation from the fit, i.e
the non-linearity. On both plots the chips are colour coded (#1:Black,
#2:Red, #3:Green, #4: Blue).
Again, we find no evidence for significant
non-linearity. WFCAM has
been constrained to be linear to <=1% by these measurements over
almost the entire range. The only significant deviations are where the
counts reach the >30,000 level - i.e. we are approaching saturation
Short vs Long exposures
An additional way to test the linearity is to ratio short and long
exposures of images which have a gradient in sensitivity across the
detector. Detector 4 has a factor 1.6 variation in sensitivity (Figure 3).
 |
Figure N: A slice through
columns 1501 - 1600 for a flatfield image on detector#4 is shown to
illustrate the variation in sensitivity across the
detector.
For a perfectly linear detector, then the ratio will be unity. If
there is non-linearity then this will result in a slope across the
ratio image correlated with the sensitivity. The figure below suggests
that there may be a very small effect.
 |
Figure N: A slice through
columns 1501 - 1600 for a 12 second flatfield image divided by a 4 second flatfield image (and normalized to the maximum), again on detector#4.
The direction of the effect suggets that an increases in brightness
leads to a reduction in the measured counts with respect to an
expected linear relation. The magnitude of the effect is around 1.5%.
Comparison with 2MASS
Typically, hundreds of 2MASS point sources fall on each detector during
each science and calibration exposure with WFCAM. We can investigate
the differences between the WFCAM and 2MASS photometry as a function
of source brightness.
The CASU pipeline calibration is based on 2MASS. Colour equations for
each filter were derived from data taken in 05A (see the
commissioning report). The 2MASS magnitude is first converted into the
WFCAM system using these colour terms.
Then for each field we then derive the photometric zeropoint as the median of:
ZP = m(2MASS) + { 2.5 x log10(counts/sec) }
over all stars on all four detectors. The Zeropoint is corrected for
extinction assuming a default value (0.05 mags/airmass for each filter).
Figure 4 shows m(WFCAM)-m(2MASS) for the J, H and K filters. The data
comprise repeat observations made on photometric nights of 7 standard
fields. These observations were spread throughout semesters 05A and
05B. The plots include data from all four detectors.
 |
 |
 |
Figure 1: Delta magnitude (WFCAM-2MASS)
versus peak counts for point sources. Data from standard star
observations in 05A and 05B from photometric nights.
The same plots for the same data but as a function of magnitude.
 |
 |
 |
Figure 1: Delta magnitude (WFCAM-2MASS)
versus magnitude for J, H and K band. Data from standard star
observations in 05A and 05B from photometric nights.
We've made a couple of tests to see if there are other dependencies in
the effect. The first plot is delta magnitude versus colour to look
for any residual colour terms.
Another question was asked. Could the effect be caused by
over/underestimation of the background for bright sources? We examine
the difference between the per-source background counts (the local
background) measured from a 64x64 pixel box, and the median frame for
the background. There is no trend in delta(magnitude) with
background. The following plot is (local-median) background against
source peak counts for the J-band. The J-background level varies
between about 300 and 1000 counts/pixel in a 10 second exposure
(depending principally on lunar phase/proximity and time of
night). The variation in background across the frame is typically
significantly less than 1%. The peak counts can also seen to be
entirely independent of the background estimate, and we see no
evidence that there is a star brightness dependent under- or
over-subtraction.
 |
Figure 1: Delta magnitude (WFCAM-2MASS)
versus delta sky level (local minus frame median) for point
sources. Data from standard star observations taken throughout 05A
and 05B on photometric nights.
Conclusions
This analysis suggests that there is a non-linearity either in WFCAM
or in 2MASS, reaching approximately 2-3% close to the saturation limit
for WFCAM (around J=10.5).
The dome flat sequence suggests that there is non non-linearity in
WFCAM larger than 1.5%. Further tests are required to understand the
cause of the m(2MASS)-m(WFCAM) residuals:
- Further dome sequences will be measured and repeated to (a)
mitigate against non-constant illumination and (b) to investigate
other filters.
- We will investigate whether there is any correlation between
linearity and incident count-rate (
c.f. NICMOS).
Update New dome sequences and
stnadard star measurements were obtained on 26th May 2006. These data
are now in Cambridge and will be processed shortly.
Simon Hodgkin
Last modified: Mon May 15 10:22:07 BST 2006