Interleaving tests
Interleaving tests
Document number: VDF-TRE-IOA-00016-0001 Version 1.1
Dafydd Wyn Evans, IoA
29 October 2004
1 Introduction
The purpose of this document is to show a simple demonstration of interleaving
(also called interlacing) and to report on a few tests carried out using
simulated WFCAM data.
Interleaving is used when data is undersampled. The technique
involves reobserving a measurement
after shifting the recording medium a fraction of the sample length. These
are then combined to form a single measurement.
In the case of a CCD and 2x2
interleaving, 4 observations are taken, shifting the CCD by half a pixel in
the appropriate directions ie. (0.0, 0.0), (0.5, 0.0), (0.0, 0.5) and (0.5,
0.5). The observations are then interleaved as if they were a single
observation with twice the resolution.
This does not regain lost resolution, but it does restore the sampling if
the PSF doesn't change.
With accurate offsetting and interleaving you can recover lost frequency
information due to the limited original sampling. The end result will be as
if you had the extra resolution but it will be convolved with the original
pixel size.
Here are some references to papers on interleaving etc. :
- [Hook, Pirzkal & Fruchter 1999]
- is a short review of available software for image
reconstruction.
- [Lauer 1999a]
- goes into the theory of interleaving and
explains a Fourier reconstruction method.
- [Lauer 1999b]
- is mainly about calibrating intrapixel
sensitivity with undersampled images.
- [Fruchter & Hook 2002]
- describes the Drizzle method for reconstructing
undersampled images.
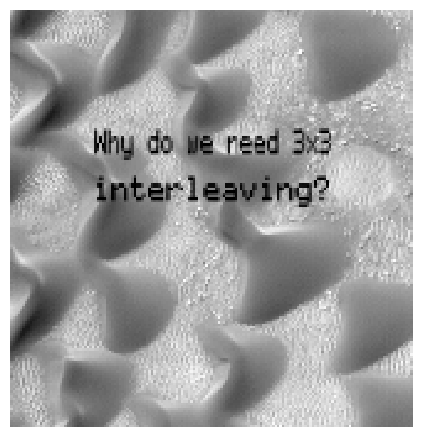
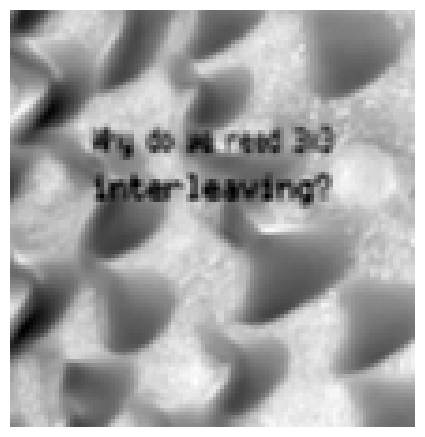
2 A simple demonstration of interleaving
In order to give a simple demonstration of interleaving an image was created
with some recognizable detail in it. This was then rebinned
such that the detail was just visible (Figure 1a). The source image
was then further rebinned by a factor of 3 (Figure 1b) in order to
provide the undersampled images. Figure 1a can be regarded as the
control image.
Various undersampled images were created with appropriate offsets to create
2x2 (Figure 1c) and 3x3 (Figure 1d) interleaved images. As
can be seen, more detail becomes apparent with interleaving, but you do not
regain full resolution as in Figure 1a since the image is convolved
with the original (Figure 1c) pixel size.
a
 b
b
|
c
 d
d
|
Figure 1: A simple demonstration of interleaving.
3 Simulations
The simulations carried out
to test the effects of interleaving on the
astrometric and photometric accuracies were done using the IRAF artdata
procedures.1
All the simulations were equivalent to J-band observations and
followed the same parameterization as in the WFCAM simulations
study
(http://www.ast.cam.ac.uk/~wfcam/docs/reports/simul/),
apart from for the seeing.
Three different sets of simulations were carried out with different
seeing conditions:
-
All four elements of the interleaved images were generated with the
same seeing (0.6").
-
Realistic seeing conditions - seeing is within 0.1" of
the median.
Each of the four elements had a randomly determined seeing taken from a
Gaussian
distribution with a mean of 0.6" and a sigma of 0.05".
-
Bad seeing conditions - seeing suddenly increases by 0.5". The
seeing is determined as in b, but for the fourth element the seeing is
increased by 0.5".
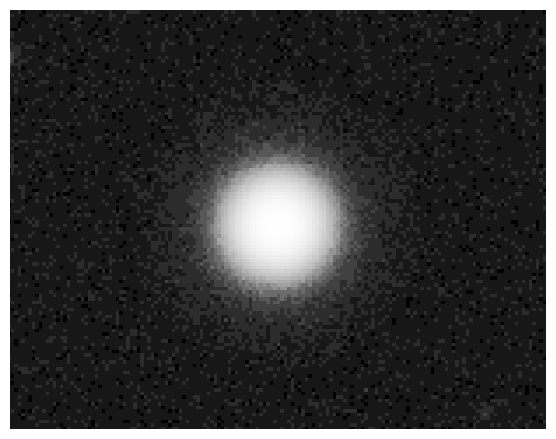
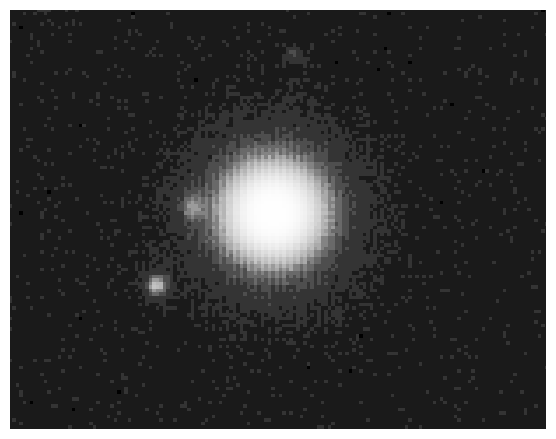
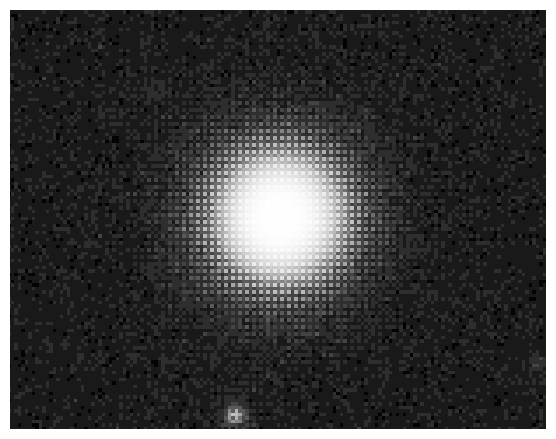
Figure 2 shows example images from each of the sets of simulations.
For images from Simulation c, "hedgehogging" of the image can be
seen where the PSF becomes spiky. It is likely that this will cause
problems to any PSF fitting algorithm used. Note that
even in realistic seeing conditions
(Simulation b) a small degree of `hedgehogging" is seen.
Figure 2: Example simulated images under different observing conditions
(all 2x2 interleaved).
In addition to these, a set of non-interleaved simulations were generated.
In order to make the comparisons equivalent in terms of total observing
time, these were generated with 4 times the exposure length.
Most of the simulations were 2x2 interleaved, but one set of 3x3 interleaved
data was generated using the realistic seeing conditions
cf. Simulation b.
4 Comparisons
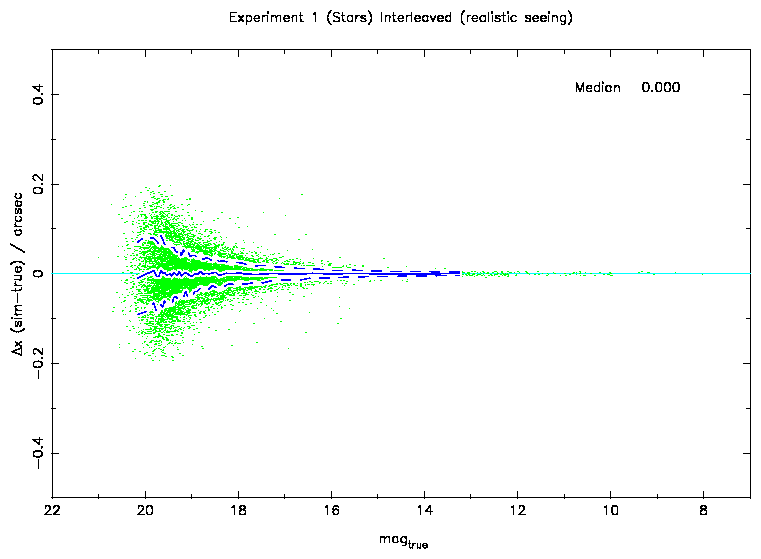
Figure 3: The residuals in x as a function of magnitude. The solid blue
line shows the median of the distribution and the dashed blue line indicates
the width (equivalent to a Gaussian sigma).
Each of the images generated were reduced using the programme
imcore_conf, the standard source detection and parameterization
programme used in CASU pipelines. Further information about how
imcore_conf works can be found in [Irwin 1996].
The x, y and flux values generated were then compared with the true
values used to generate the artdata simulations. The widths of these
distributions were then measured as a function of magnitude (see
Figure 3). This gives a reasonable estimate for the errors in
these parameters.
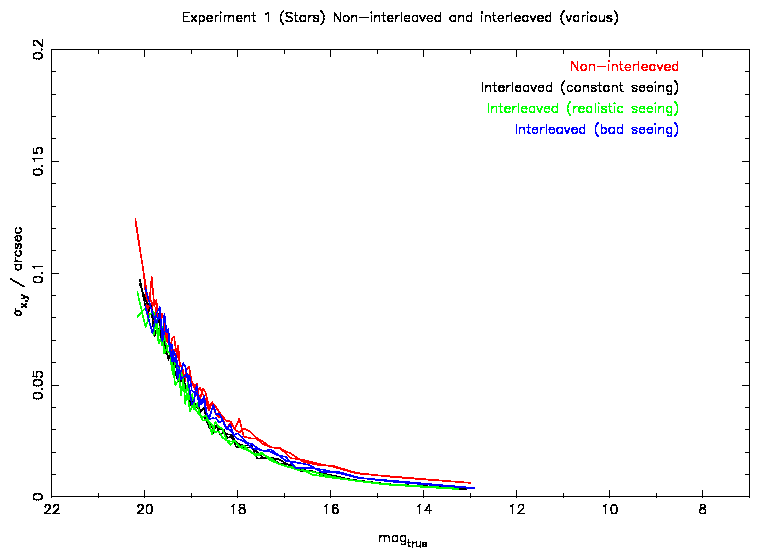
Figure 4: Astrometric errors as a function of magnitude. The results from the
different simulations are in different colours. For each simulation a line
is drawn for the errors in both x and y.
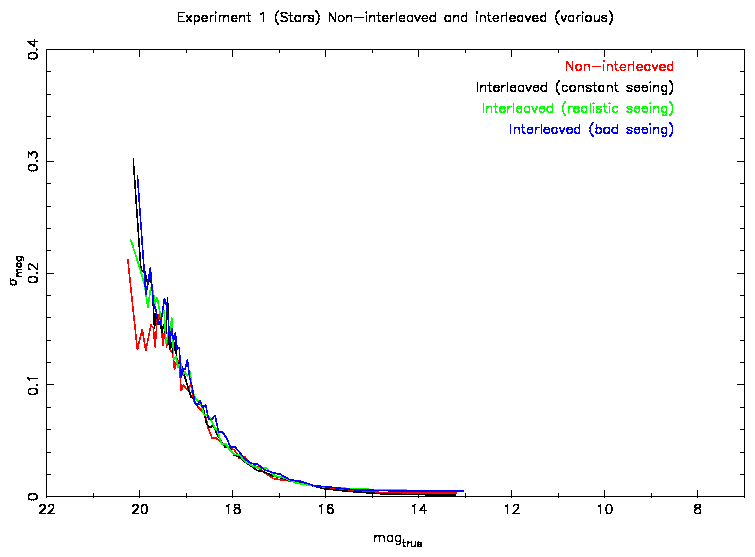
Figure 5: Photometric errors as a function of magnitude.
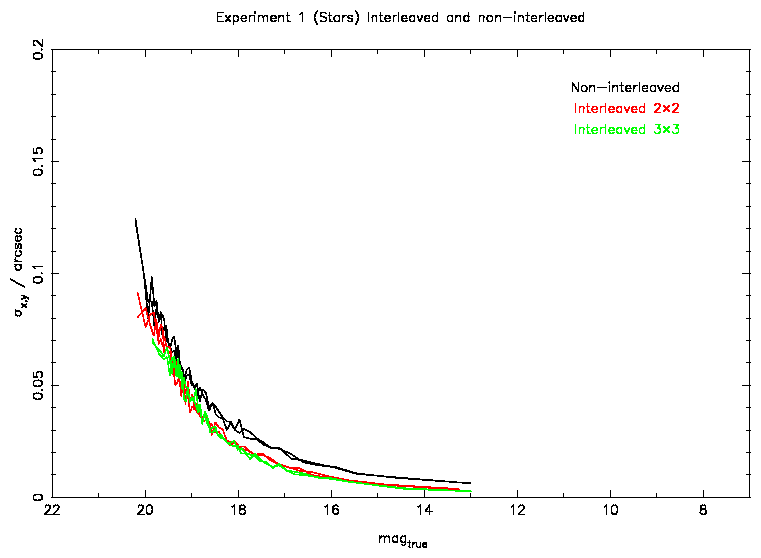
Figure 6: Astrometric errors as a function of magnitude for different
interleaving configurations.
5 Conclusions
Analysis of the errors (Figures 4 and 5) show
that there is not much difference between the 3 seeing cases for the
interleaved reductions ie. interleaving seems to work reasonably well even in
Simulation c.
For the non-interleaved astrometry (with same total exposure time) the
bright end accuracy is two times worse. At the faint end there is no
difference. This is due to the effect of undersampling, which is independent
of magnitude, being swamped by Poisson noise effects.
For photometry, there is no difference between the interleaved and
non-interleaved simulations. This is basically due to the pixels effectively
acting as photon buckets.
The difference between 2x2 and 3x3 interleaved data and non-interleaved data
is shown in Figure 6. The 2x2 interleaved astrometry is about 2
times more accurate than the non-interleaved data at the bright end, while
the 3x3 interleaved astrometry does not show much further improvement. This
shows that the optimal sampling has already been achieved with the 2x2
interleaving.
At the
faint end there is no significant difference in the astrometric accuracies.
The photometric errors show no differences between the interleaving
configurations cf. Figure 5.
While these simulations show that the bright end astrometric errors are of
order 5 mas or better for the 2x2 and 3x3 interleaved data, it is likely that
in real life some additional errors will be present that have not been
accounted for in these simulations eg. differential radial field
distortions
(see
http://www.ast.cam.ac.uk/~wfcam/docs/reports/astrom/).
Also, these results will be indicative of relative astrometric and
photometric errors. The absolute errors will depend on how well the
standards can be applied.
References
- [Fruchter & Hook 2002]
-
Fruchter A.S., Hook R.N.,
2002, PASP, 114, 144
`Drizzle: A Method for the Linear Reconstruction of Undersampled Images'
- [Hook, Pirzkal & Fruchter 1999]
-
Hook R.N., Pirzkal N., Fruchter A.S.,
1999, ADASS VIII ASP Conf., 172, 337
`Combining Undersampled Dithered Data - A Review of the Options'
- [Irwin 1996]
-
Irwin M.J.,
1996, Instrumentation for Large Telescopes,
VII Canary Islands Winter School, eds. J.M.Rodríguez
Espinosa, A.Herrero, F.Sánchez, p. 35.
`Detectors and Data Analysis Techniques for Wide Field Optical Imaging'
- [Lauer 1999a]
-
Lauer T.R.,
1999, PASP, 111, 227
`Combining Undersampled Dithered Images'
- [Lauer 1999b]
-
Lauer T.R.,
1999, PASP, 111, 1434
`The Photometry of Undersampled Point-Spread Functions'
A postscript version of this report can be found at
http://www.ast.cam.ac.uk/~wfcam/docs/reports/interleaving/interleaving.ps.
Footnotes:
1When carrying out these simulations it is important to
use the command artdata nxc=25 nyc=25 so that the PSFs are integrated
with sufficient detail.
File translated from
TEX
by
TTH,
version 3.30.
On 29 Oct 2004, 18:35.
 a
a
 b
b
 c
c