r_true = k1 * r + k3 * r**3 + k5 * r **5
where r_true is an idealised angular distance from the optical axis and r is the measured distance. k1 is the scale at the centre of the field, usually quoted in arcsec/mm.
WFCAM and VISTA are no exception and prior to on-sky measurements being available, ray-tracing enables an estimate of the expected field distortion to be made.
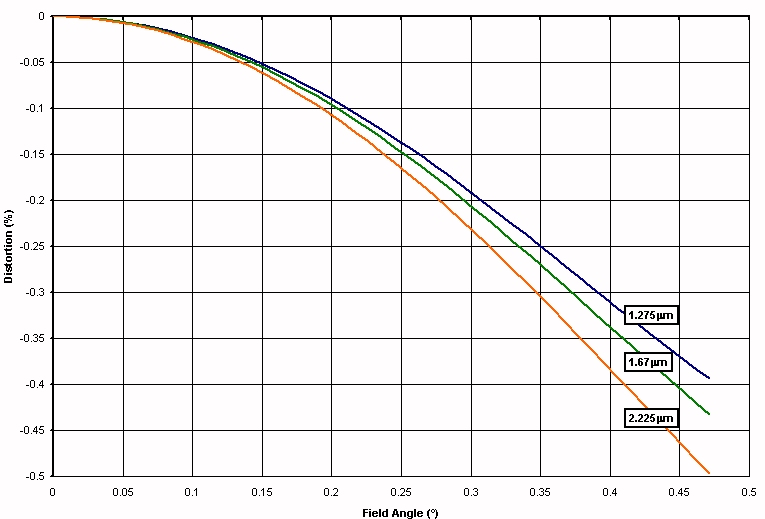
The above figure shows the non-linear distortion (ie. % scale change) expected for WFCAM as a function of wavelength. For VISTA there is negligible variation with wavelength and the following figure shows the tabulated K-band distortion, (red splodges), with an "r-cubed" fit superimposed (green circles).
In the K-band WFCAM and VISTA will have scales, ie. k1 values, of 22.30 and 17.09 arcsec/mm respectively. The term due to k5 is usually negligible and until real sky data is available is not worth pursuing, since other similarly sized distortions may be present. Rearranging the preceding equation to a more convenient form gives
r_true = r' * (1 + k3/k1**3 * r'**2) = r' + k * r'**3
where r' is the measured distance from the optical axis in arcsec using the k1 scale. If we convert all units to radians the "r-cubed" coefficient is conveniently scaled (in units of radians/radian**3 - honest!) and has values of 76.1 and 42.5 in the K-band for WFCAM and VISTA respectively.
[Measurements on real WFCAM data indicate that this coefficient is more like -50.0, ie. apart from the sign and magnitude it was about right. Note that subsequent numbers for WFCAM have been updated to correspond to the real on-sky values.]
Although this type of distortion generally presents no problem for accurate calibration of individual pointings, it can lead to various complications when stacking data taken at various locations, eg. dither sequences. This is caused by the differential non-linear distortions across individual detectors being comparable to, or larger than, the pixel size of the detector. In these cases stacking involves resampling and interpolation of some form. While these are inevitable in combining pointings to form contiguous tiled regions, they may be avoided at earlier stages, such as stacking individual detector dither sequences, by suitably limiting dither offsets and thereby both simplify and speed up the data processing.
The following figures demonstrate the level of this optical distortion over the field of view.
For WFCAM the non-linear term introduces a (pincushion/barrel) distortion amounting to roughly 10 arcsec from the centre to the edge of the 0.8 degree diameter field, denoted by the blue circle.
For VISTA the corresponding numbers are a distortion of around 25 arcsec at the edge of the 1.67 degree diameter field, denoted by the blue circle.
We can quantify this effect in a more useful manner by forming
dr_true/dr' = 1 + 3k * r'**2
which describes the local change in relative pixel scale as a function of radial distance. For example, for WFCAM at around 0.45 deg radius, the second term is about 1.0% in size (ie. 3x the radial distortion value shown in the earlier plots). This means that a 10 arcsec shift in the centre corrsponds to a 10.1 arcsec shift at the outer corners of the arrays. The majority (~90%) of this distortion occurs across individual detectors. Therefore, even after re-registering the detector centre, there would still be a distortion at the +/-0.05 arcsec level across it.
To first order the size of this effect clearly scales as the size of the offset (though of course the pattern induced depends on the direction). Confining dither offsets (and microsteps) to within +/-5 arcsec of a target centre (a reasonable practical compromise of various constraints) would enable nonlinear resampling for "dither" stacks of each detector to be avoided for WFCAM but possibly not for VISTA. Of course tiling contiguous regions by filling in the gaps between detectors with additional pointings will always involve non-linear resampling as will large offset pattern dither sequences.
(1 + k r'**2).(1 + 3k r'**2) =~ (1 + 4k r'**2)
or in other words roughly 4x the linear scale distortion.
At the corners of the field WFCAM has a worst case (K-band) linear scale distortion of about 0.3% leading to photometry systematics due to this effect of at most ~1.2% relative to the centre, and can probably be safely ignored for most applications. If required it is also feasible for this correction to be factored in with the "mesostep" correction for scattered light photometric systematics. To illustrate the effect the following colourful image shows the systematics in photometry that would arise from a standard WFCAM 4 pointing tile.
The systematics vary from 0% in the centre up to 0.5% lighter shades of green, through purple and red at 1.0% to yellow, 1.5% in the corners. The field of view shown is roughly 0.8 deg x 0.8 deg. The exposure map below shows how this relates to the final field.
Grey-green equates to 1; puprle 2; and yellow 4.
For VISTA however, the scale distortion at the edge amounts to some 0.8% - 0.9% implying worst case photometry systematics of order 3.5% from centre to edge of field.
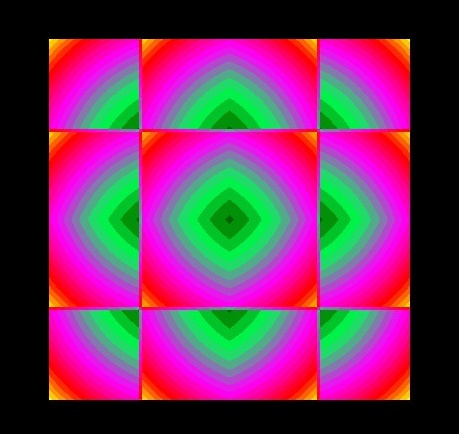
Given that tiling of 6 pointings to create a "uniform" contiguous coverage of the 1.67 degree diameter field is likely to be the baseline mode of operation for VISTA, further modelling is required to see if the resultant systematics are large enough to warrant special attention during pipeline processing and at the mosaicing stage. Stacking individual detector dithers is not a problem (other than needing to cope with non-linear astrometric distortions). The next colourful image shows the systematics in photometry arising from a standard VISTA 6 pointing tile.
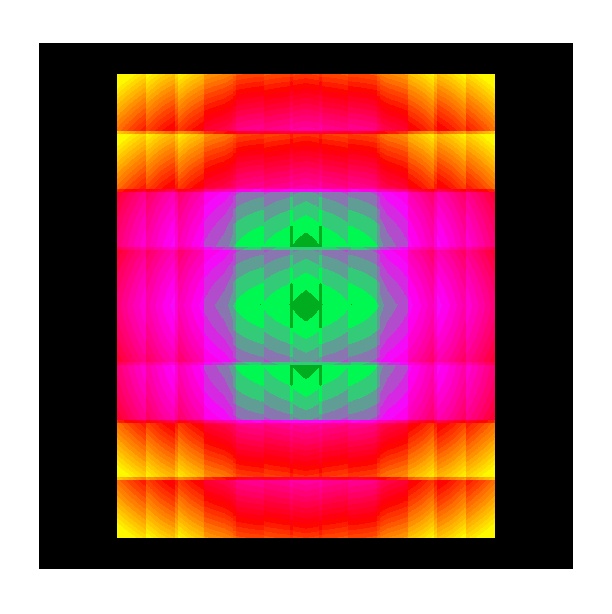
The systematics vary from 0% in the centre up to 1% lighter shades of green, through purple and red at 2-2.5% to yellow, 3% toward the corners. The field of view shown is roughly 1.2 deg x 1.5 deg. The exposure map below shows how this relates to the final field.
Green equates to 1; grey-green 2; purple 3; red; 4 and yellow 6.
CTYPE1  = 'RA---ZPN'           / Zenithal polynomial projection
CTYPE2  = 'DEC--ZPN'           / Zenithal polynomial projection

CRPIX1  =     3914.68291287068 / Reference pixel on axis 1
CRPIX2  =     2958.23149413302 / Reference pixel on axis 2
CRVAL1  =             325.5563 / Value at ref. pixel on axis 1
CRVAL2  =            0.2084674 / Value at ref. pixel on axis 2
CD1_1   =  -1.4011089128826E-6 / Transformation matrix
CD1_2   =  -9.2625825594913E-5 / Transformation matrix
CD2_1   =  -9.2750922381494E-5 / Transformation matrix
CD2_2   =  1.31362241659925E-6 / Transformation matrix

PV2_1   =      1.0             / coefficient for r term
PV2_3   =    220.0             / coefficient for r**3 term
and is the style we are proposing to adopt for both WFCAM and VISTA.